Ransomware Protection Dashboard
Analytics dashboard and reporting workflow that translates security exposure into prioritized action.
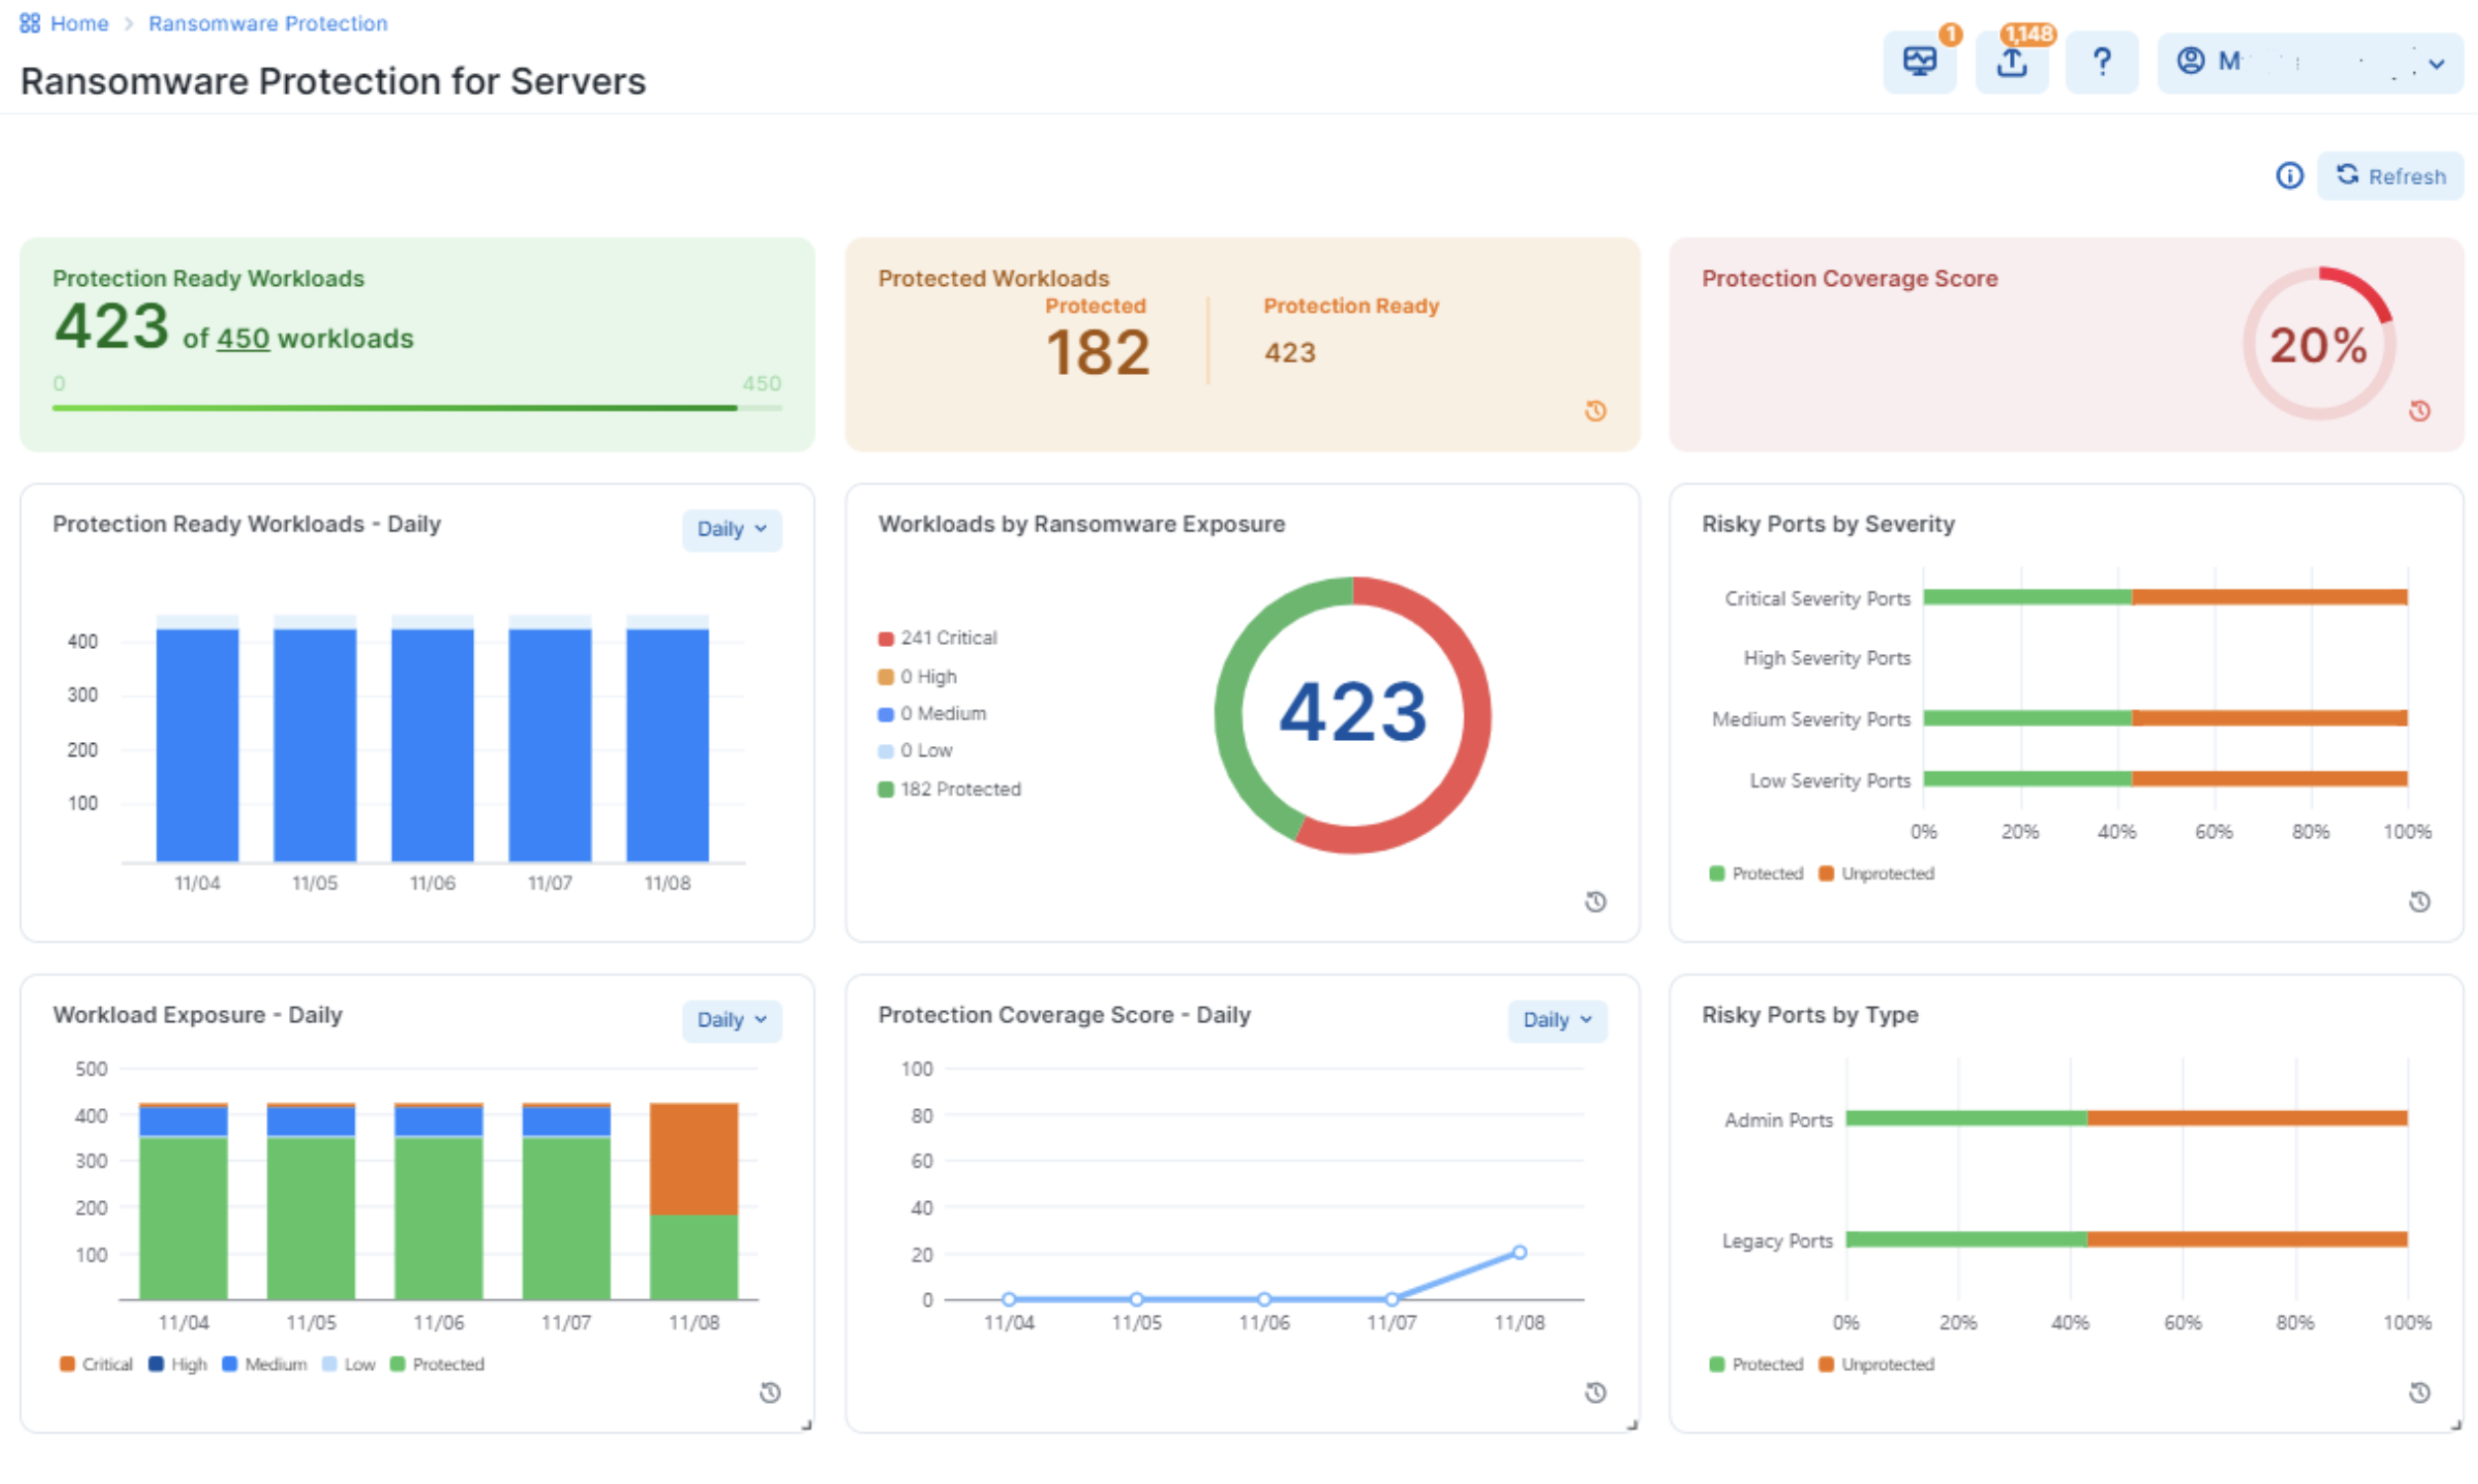
Brief
Developed a ransomware protection analytics experience supported by a batched reporting service for scheduled CSV and PDF visibility reports.
Problem
Security and executive stakeholders needed a trustworthy view of ransomware exposure, risk distribution, and protection gaps, with both interactive exploration and recurring reporting.
Approach
I built across the frontend, APIs, data integration, and automated quality layers, partnering with product and design to organize complex security metrics into a readable hierarchy.
Highlights
- Used AG Grid for dense, sortable detail views.
- Built ECharts and D3.js visualizations for overview, comparison, and drill-down analysis.
- Implemented Ruby on Rails and Redis batched reporting with PostgreSQL-backed REST APIs.
- Added Cypress end-to-end, unit, component, and nightly regression coverage for analytical workflows.
Outcome
Delivered one experience for interactive analysis and repeatable reporting, helping stakeholders move from high-level risk trends to the underlying workloads and actions.
Stack
React, TypeScript, AG Grid, ECharts, D3.js, Ruby on Rails, Redis, PostgreSQL, REST, Cypress.