Illumination Plus + Temporal Exploration
Large-scale network visualization and timeline-based graph prototypes for policy analysis, traffic flow, and anomaly investigation.
Brief
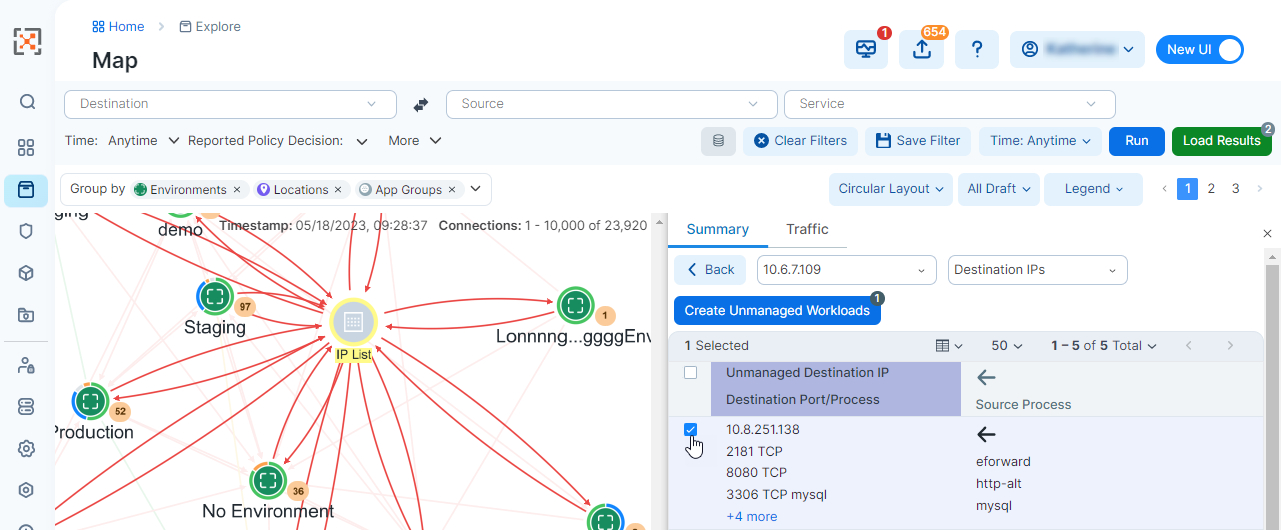
Led product and engineering work on Illumination Plus, a large-scale network visualization experience for understanding application relationships, traffic flow, policy, and change over time.
Problem
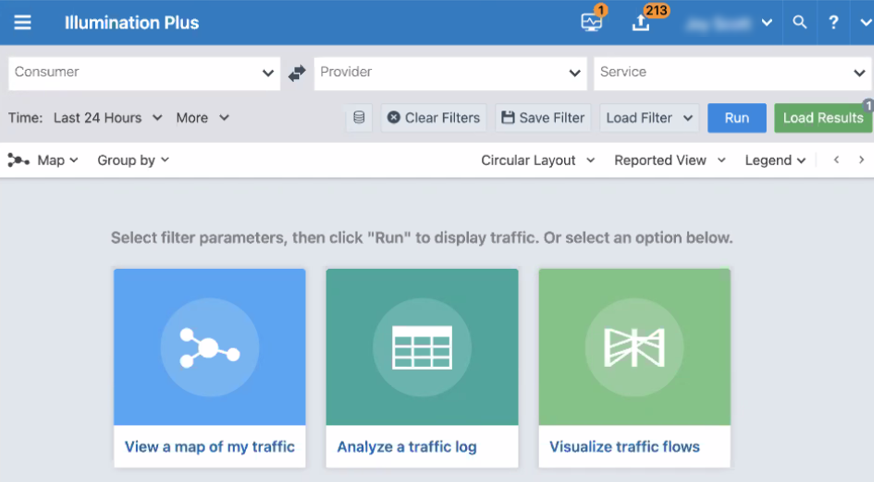
Security teams needed to understand complex application topology and traffic behavior before writing policy. Static tables could not communicate network structure, temporal changes, or anomalous relationships efficiently at enterprise scale.
Approach
I translated investigation and policy tasks into graph interactions, then partnered with product managers and users to evaluate temporal encodings, timeline navigation, comparison patterns, and visual trade-offs for exploring time-series network data at scale.
Highlights
- Built graph encodings and interaction patterns for topology, traffic direction, grouping, filtering, focus, and policy context.
- Prototyped timeline-based ReGraph and KronoGraph experiences for analyzing how nodes and edges appeared, disappeared, or changed across time windows.
- Connected prototypes to backend data contracts and reusable frontend patterns.
- Drove TypeScript migration and component reuse so complex visualization workflows were easier to maintain.
- Evaluated performance and usability for large graphs through progressive disclosure and task-focused detail.
Outcome
The platform supported 100,000+ workloads and 50,000+ users. The prototype gave product, design, and engineering teams a concrete way to evaluate temporal graph exploration before committing to a production direction.
Stack
React, TypeScript, Redux, ReGraph, KronoGraph, D3.js, OpenAPI, graph data.