AuroraMap
Boundary-homographic visualization for mapping multivariate 2D spatial distributions.
Explore the project at: https://www.youtube.com/watch?v=7ajaTj00VyM
View the research paper at: https://www.semanticscholar.org/paper/AURORAMAP%3A-A-BOUNDARY-HOMOGRAPHIC-VISUALIZATION-FOR-Han/6b4434fe9103df829446c63b98fca85883728e54
View Open Source algorithm repo here: https://github.com/Lynnhan95/contour-vis
Brief
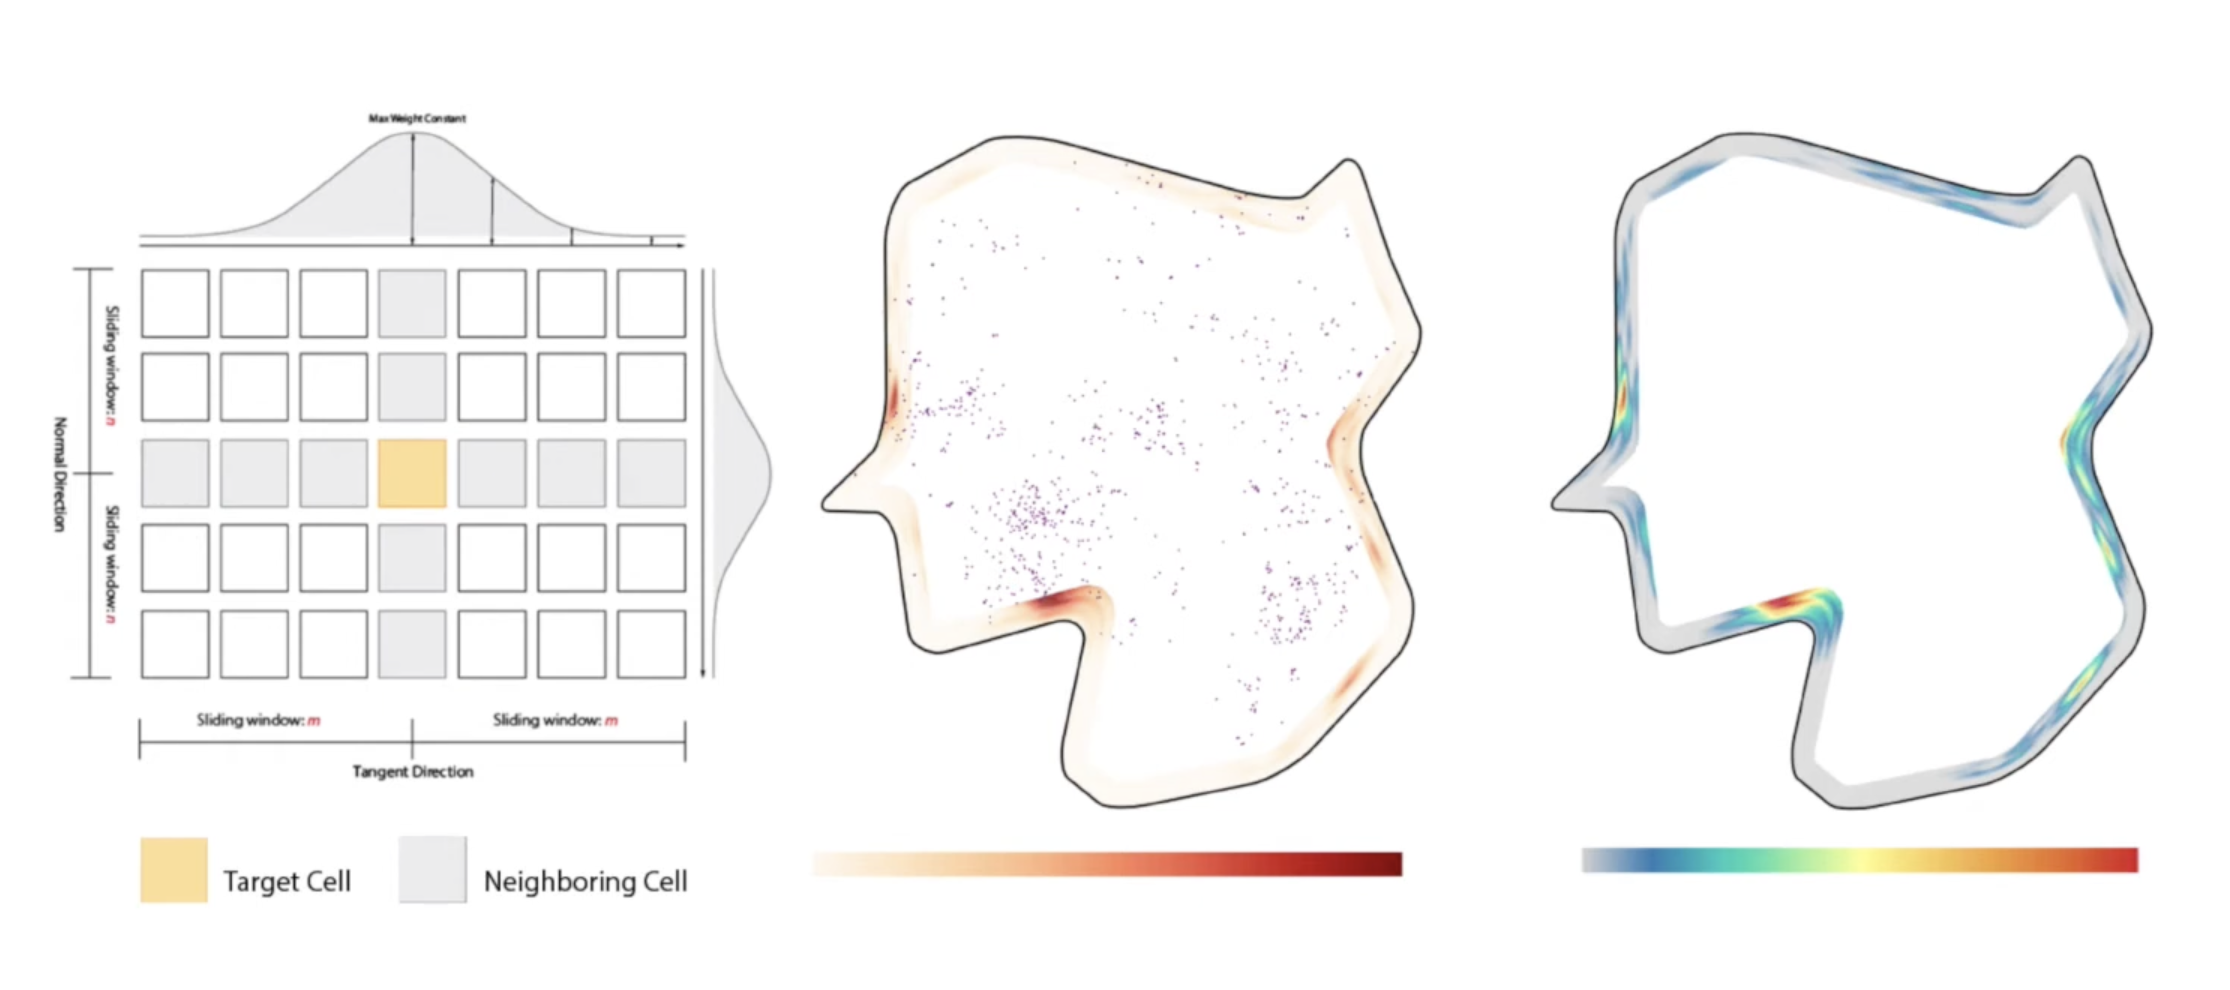
AuroraMap is a research visualization method for mapping multivariate 2D spatial distributions. It projects clusters from a spatial distribution to a boundary band and color-encodes their densities so dense internal structures can be read without filling the main map area.
Problem
Multidimensional spatial data can be difficult to compare when multiple variables, clusters, and complex geographic boundaries compete for screen space. Traditional encodings often obscure cluster density or make it hard to compare several spatial distributions in one view.
Approach
The work proposed an abstract contextual visualization that moves cluster density information to the boundary of spatial distributions. This keeps the central spatial shape readable while preserving cues about cluster location, scope, and density.
Highlights
- Proposed a boundary-homographic projection for encoding cluster structure around spatial distributions.
- Used continuous color encoding to communicate cluster densities.
- Evaluated whether users could detect relative cluster locations, cluster scopes, and peak density values.
- Demonstrated the method with real-world religious infrastructure data and multivariate geospatial comparisons.
Outcome
The research contributed a visual strategy for saving map space, supporting quantitative cluster-density estimation, and comparing multiple spatial distributions in one graph.
Links
Watch IEEE Vis AuroraMap
Read the Purdue thesis record
Stack
Data visualization research, spatial distributions, density encoding, visual analytics, geospatial visualization.