Building a D3 + React Superhero Hexagon Chart
A short tutorial on using D3 for visualization math while keeping React in charge of components and SVG rendering.
This project started as a small superhero comparison app: search for characters, add them to a generated list, and compare their power stats through visual charts. The stack was React, D3, Redux, and the Superhero REST API.
The useful engineering lesson is not only the chart type. It is the boundary between React and D3.
React is best at state, components, and rendering. D3 is best at data mapping, scales, geometry, and shape generation. When the two tools share that boundary clearly, the code stays easier to reason about.
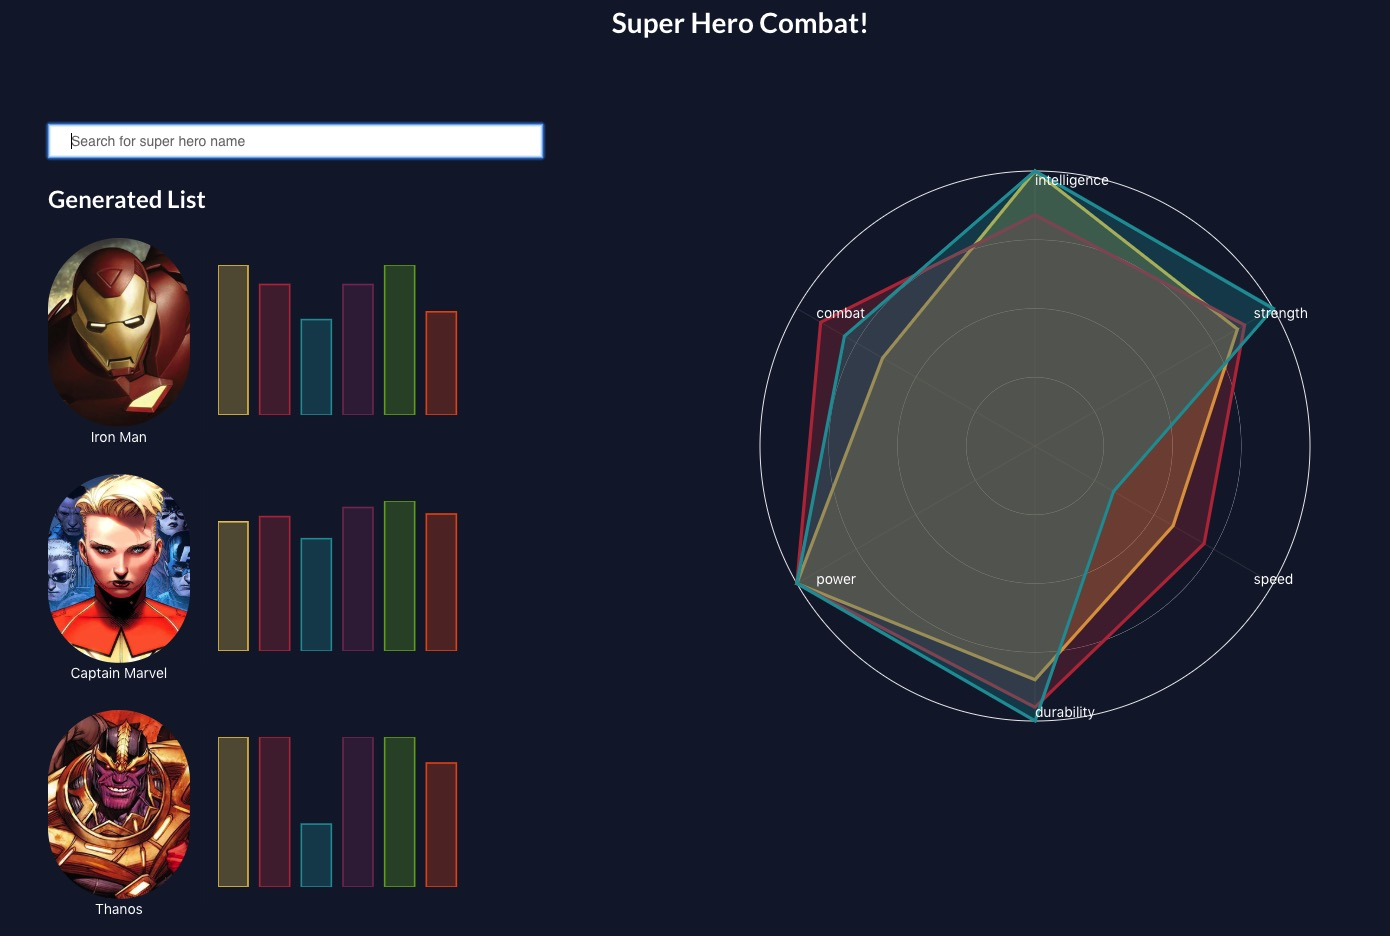
Why D3 instead of a charting library
A charting library would be faster for a standard bar chart, but the radar chart needed a custom shape language: six superhero attributes, multiple overlapping profiles, dark UI styling, hover behavior, and a hexagon grid. D3 gives lower-level control over the visual encoding without forcing the rest of the app to become imperative.
The tradeoff is that you write more chart logic yourself. For this kind of portfolio project, that tradeoff is useful: it shows how data becomes geometry.
Component shape
The app can be organized into five UI components:
- Search box with a close action
- Search results list with select buttons
- Generated hero list with profiles
- Bar chart for individual hero stats
- Hexagon/radar chart for comparing selected heroes
The data flow is simple: the search function fetches API results, the user selects heroes, Redux stores the selected list, and the chart components receive clean hero data as props.
15-minute build: the hexagon chart
Start by normalizing the API response. Superhero stats often arrive as strings, so convert missing or invalid values into 0 before drawing.
Then use D3 only for the math: map 0-100 stat values into radial distance and derive each hexagon point from angle and radius. Let React render the <svg>, <line>, <text>, and <path> elements.
import { scaleLinear } from "d3";
import { useMemo, useState } from "react";

const metrics = ["intelligence", "strength", "speed", "durability", "power", "combat"] as const;

type Metric = (typeof metrics)[number];
type Hero = {
  id: string;
  name: string;
  color: string;
  powerstats: Record<Metric, string | number>;
};

function stat(value: string | number) {
  const parsed = Number(value);
  return Number.isFinite(parsed) ? parsed : 0;
}

export function HeroHexagonChart({ heroes }: { heroes: Hero[] }) {
  const [activeHero, setActiveHero] = useState<string | null>(null);
  const size = 360;
  const radius = 150;
  const center = size / 2;

  const r = useMemo(() => scaleLinear().domain([0, 100]).range([0, radius]), [radius]);

  const pointsFor = (hero: Hero) =>
    metrics.map((metric, index) => {
      const angle = (Math.PI * 2 * index) / metrics.length - Math.PI / 2;
      const distance = r(stat(hero.powerstats[metric]));
      return [Math.cos(angle) * distance, Math.sin(angle) * distance];
    });

  const pathFor = (hero: Hero) =>
    pointsFor(hero)
      .map(([x, y], index) => `${index === 0 ? "M" : "L"} ${x.toFixed(2)} ${y.toFixed(2)}`)
      .join(" ") + " Z";

  return (
    <svg viewBox={`0 0 ${size} ${size}`} role="img" aria-label="Superhero power comparison">
      <g transform={`translate(${center} ${center})`}>
        {metrics.map((metric, index) => {
          const angle = (Math.PI * 2 * index) / metrics.length - Math.PI / 2;
          return (
            <line
              key={metric}
              x2={Math.cos(angle) * radius}
              y2={Math.sin(angle) * radius}
              stroke="currentColor"
              opacity={0.2}
            />
          );
        })}
        {heroes.map((hero) => (
          <path
            key={hero.id}
            d={pathFor(hero)}
            fill={hero.color}
            stroke={hero.color}
            fillOpacity={activeHero === hero.id ? 0.35 : 0.2}
            strokeWidth={activeHero === hero.id ? 3 : 2}
            onPointerEnter={() => setActiveHero(hero.id)}
            onPointerLeave={() => setActiveHero(null)}
          />
        ))}
      </g>
    </svg>
  );
}
The pattern scales well because React owns the DOM lifecycle. D3 never selects or mutates nodes directly; it only answers visualization questions:
- What is the radius for this stat?
- Where should each metric sit around the hexagon?
- What SVG path represents this hero profile?
Practical workflow
I would build this in this order:
- Fetch and inspect the API response.
- Store selected heroes in application state.
- Render the search box, search list, and generated list in React.
- Build a small bar chart for one hero’s six stats.
- Add the hexagon chart once the data shape is stable.
That workflow keeps the product loop grounded. First make the data visible, then refine the visual encoding.
Takeaway
For D3 + React work, I prefer a clean division of labor: D3 for scales, geometry, and shape logic; React for components, state, events, and SVG elements. It keeps custom visualization flexible without fighting React’s rendering model.